Unlock the full potential of your data with Excel Pivot Tables! Whether you're new to Pivot Tables or looking to sharpen your advanced skills, this course will guide you from the basics to expert-level data analysis. You’ll learn how to organize, summarize, and visualize data effortlessly, creating dynamic reports and dashboards.
What You’ll Learn:
Create Pivot Tables from scratch to summarize large datasets.
Apply powerful functions such as Sum, Count, Average, Min, and Max.
Use "Show Values As" to display percentages, running totals, and differences.
Master sorting and filtering with Label, Value Filters, and Report Filter Pages.
Add interactivity with Slicers and Timelines for real-time filtering.
Customize layouts and apply Conditional Formatting to highlight key insights.
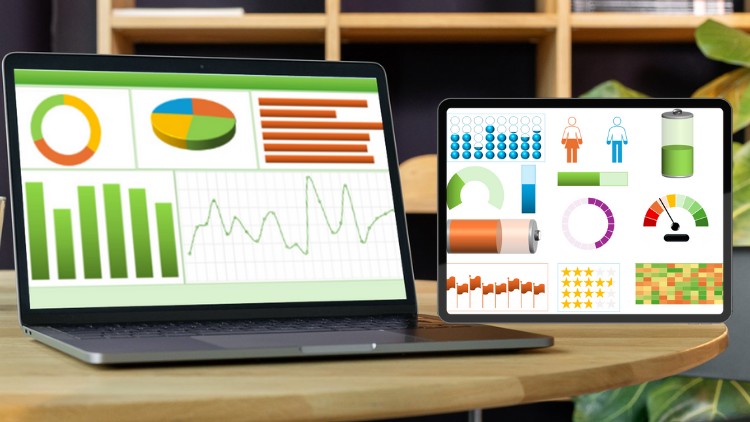
Create Advanced Charts such as Heatmaps, Histograms, Progress Bars, and more using Pivot Tables.
Connect your charts with Slicers to enhance interactivity and data exploration.
Design Dynamic Dashboards by combining Pivot Tables, Charts, and Slicers.
Implement advanced techniques like GETPIVOTDATA, cross-filtering, and external data connections.
Leverage Calculated Fields and Calculated Items for custom calculations.
Key Features of the Course:
Step-by-step tutorials: Simple explanations to help you build confidence.
Hands-on exercises: Practice with real-world datasets for better understanding.
Pro tips & tricks: Learn secret tips to enhance your productivity with Pivot Tables.
Dynamic Dashboards: Build interactive dashboards with Pivot Tables, Charts, and Slicers.
Downloadable Resources: Get access to sample files and templates for practice.
Who This Course is for:
Beginners who want to learn the basics of Pivot Tables.
Professionals looking to create insightful reports and dashboards.
Analysts aiming to automate and simplify data analysis.
Business owners who want to track and manage data effectively.
By the end of this course, you’ll have the skills to create professional-grade Pivot Table reports and dashboards that will impress your team and stakeholders.
Join now and take your Excel skills to the next level!